AFLAC (AFL)·Q4 2025 Earnings Summary
Aflac Crushes EPS Estimates by 40% on Investment Gains; Raises Dividend for 43rd Straight Year
February 5, 2026 · by Fintool AI Agent
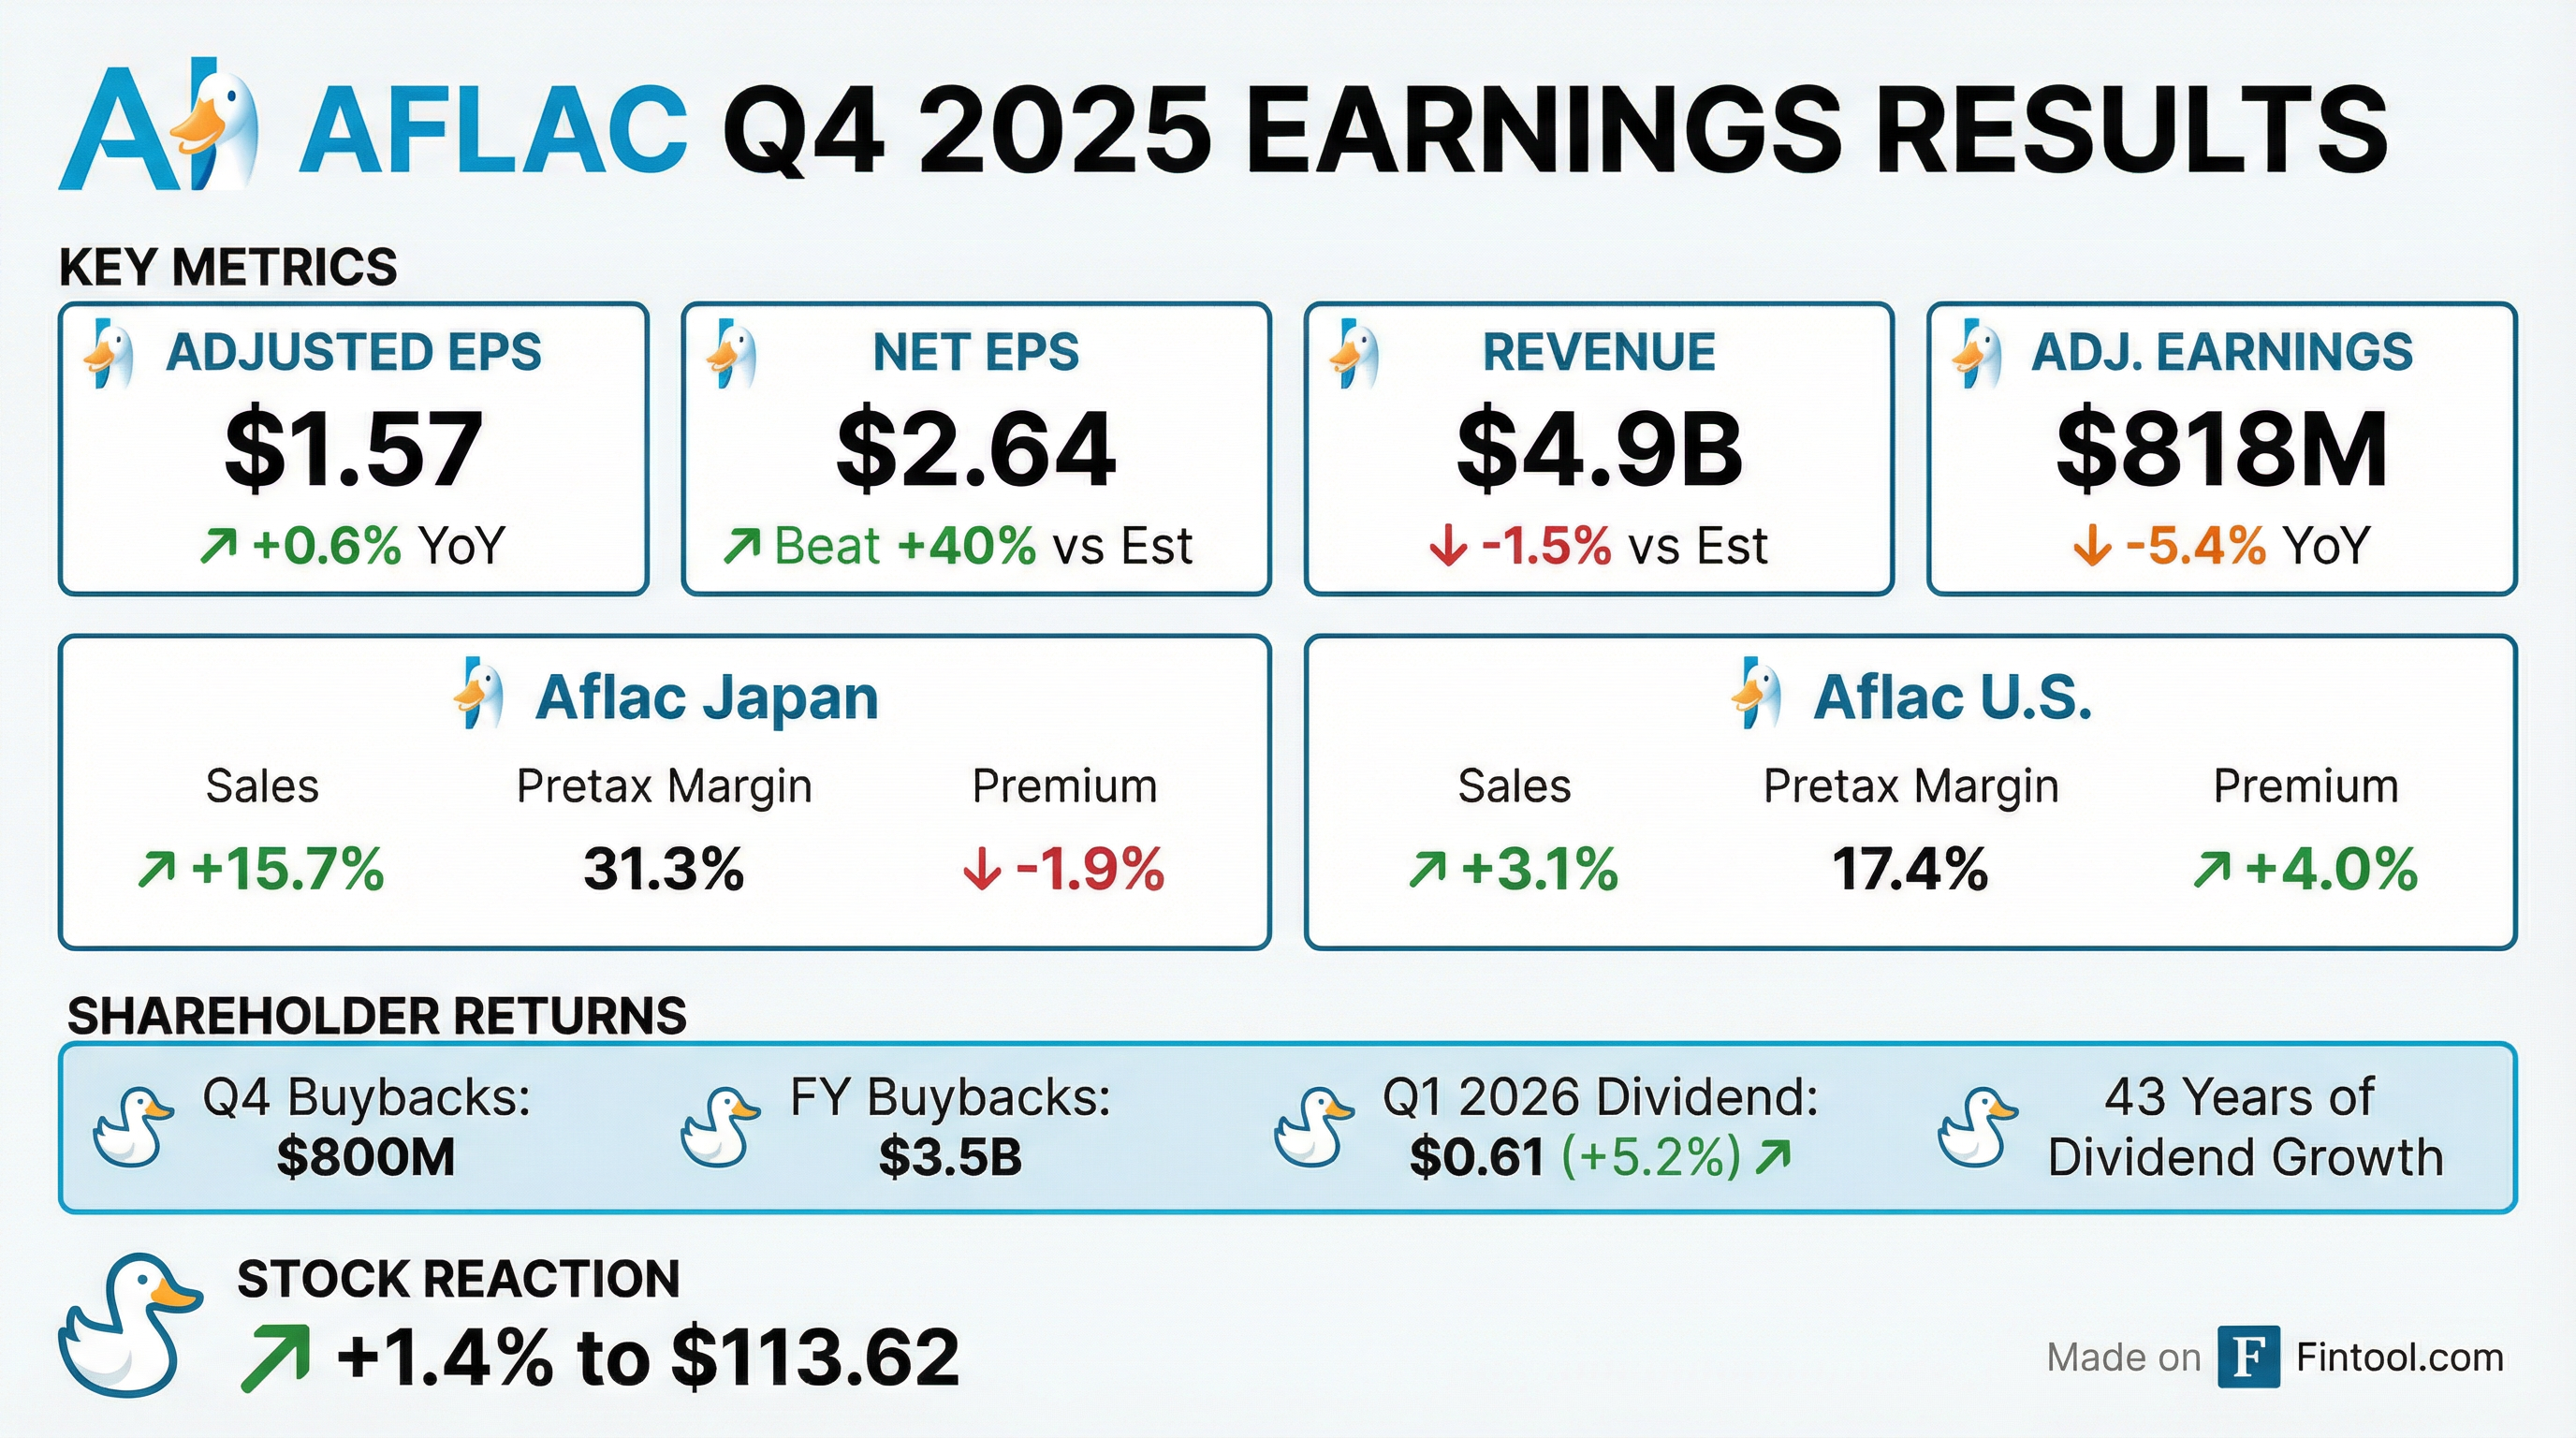
Aflac (NYSE: AFL) reported Q4 2025 results that significantly exceeded EPS expectations while modestly missing on revenue. Normalized EPS of $2.49 crushed the $1.78 consensus by 40%, boosted by $537 million in net investment gains from derivatives and foreign currency activities . The stock rose 1.4% to $113.62 following the release, approaching its 52-week high of $115.84.
The headline numbers mask a more nuanced operating picture. Adjusted earnings per share—which strips out volatile investment gains—came in at $1.57, up just 0.6% year-over-year . Total revenues declined 9.9% to $4.87 billion, reflecting lower investment gains compared to Q4 2024's $1.0 billion windfall .
Did Aflac Beat Earnings?
EPS: Significant Beat | Revenue: Slight Miss
*Values retrieved from S&P Global
The 40% EPS beat was almost entirely driven by investment gains. Net investment gains totaled $537 million in Q4 2025 (contributing $1.03 per share), versus $1.03 billion ($1.86 per share) in Q4 2024 . These gains came from:
- Net gains on derivatives and FX activities: $588 million
- Equity securities fair value gains: $25 million
- Net losses from sales and redemptions: $(51) million
Stripping out these volatile items, adjusted earnings fell 5.4% to $818 million, reflecting higher benefits expenses and lower floating-rate investment income . Reserve remeasurement gains totaled $36 million in the quarter, reducing benefits . Variable investment income ran $12 million below long-term return expectations .
What Happened by Segment?
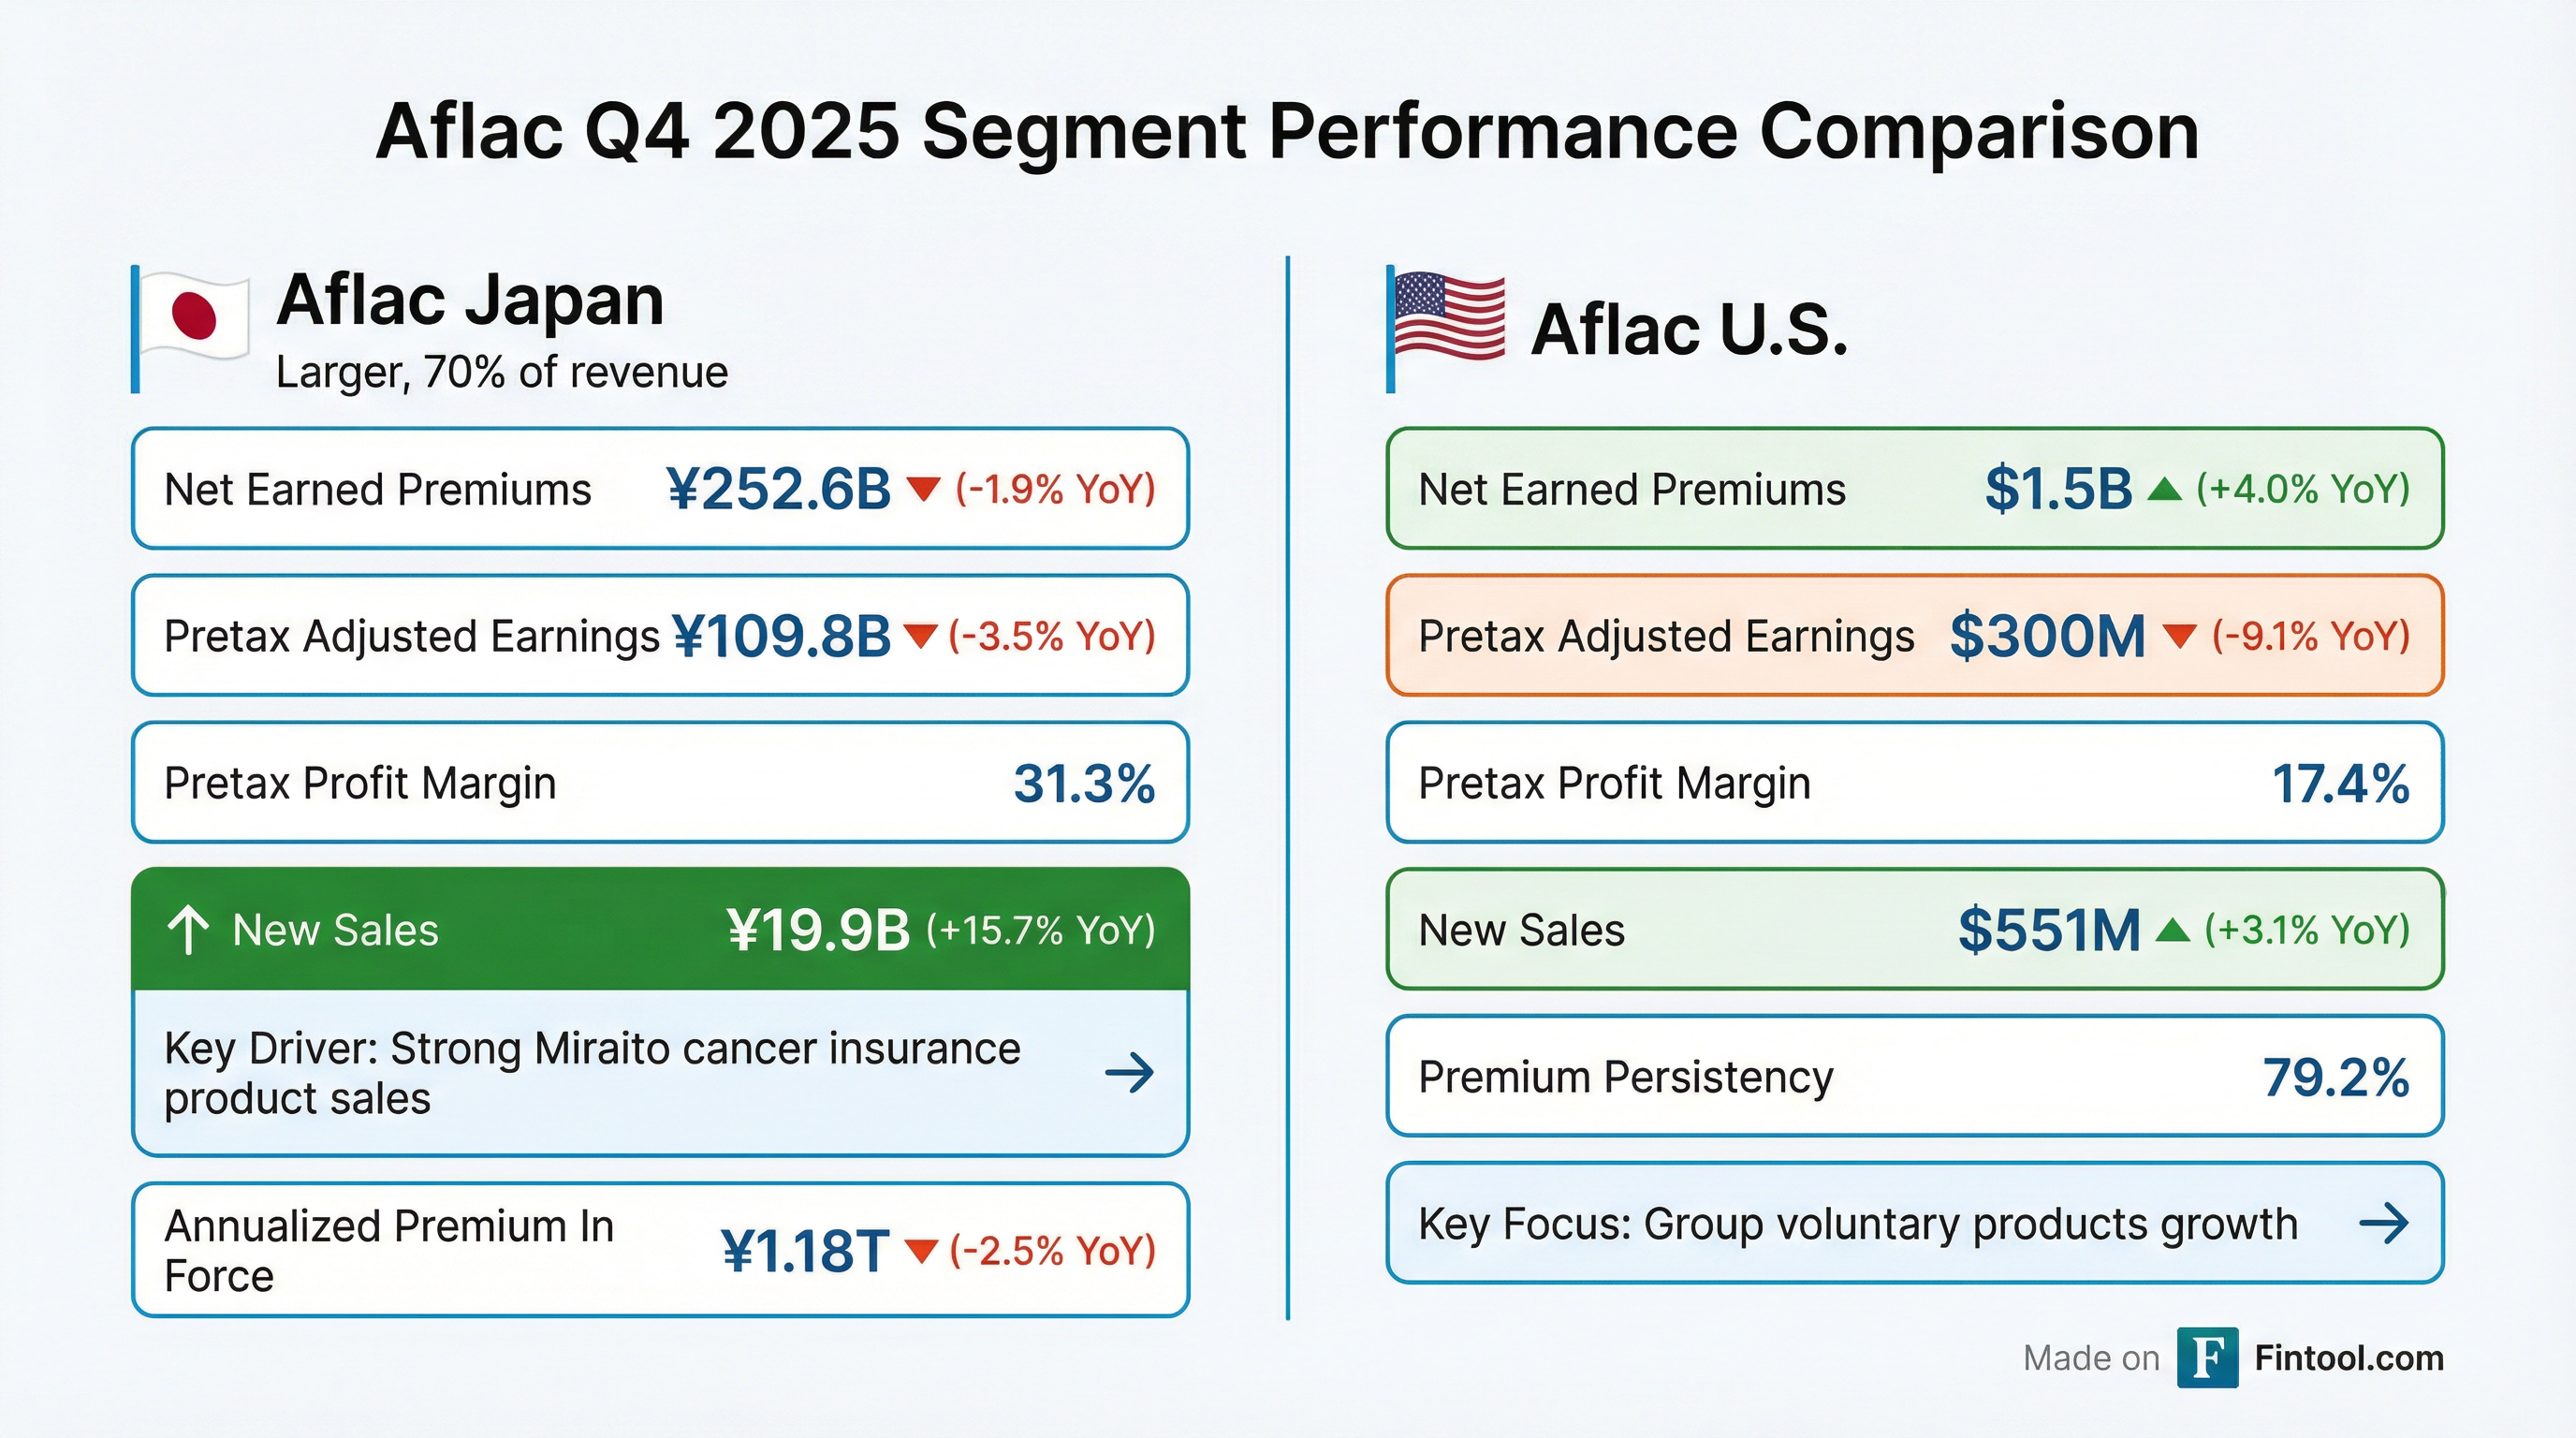
Aflac Japan: Sales Surge, Premiums Decline
Aflac Japan—representing roughly 70% of pretax adjusted earnings—delivered mixed results:
Source:
Japan's total benefit ratio came in at 65% for the quarter, down 150 basis points year-over-year. Reserve remeasurement gains impacted the benefit ratio by approximately 110 basis points favorably . Long-term experience trends related to cancer treatments and hospitalization continue to drive favorable underwriting results .
The standout was sales growth of 15.7%, driven by strong demand for Miraito, Aflac's new cancer insurance product . CEO Dan Amos noted the company launched Anshin Palette, a new medical policy, in late December and will promote it alongside Miraito and Tsumitasu in 2026 .
On the Q4 earnings call, Amos set expectations for 2026:
"Moraito, our newest cancer policy, did terrific, better than we even thought... Saying that, we had enormous sales in 2025, and we would expect sales to be more level. Where I think you'll see an increase in sales will be at the medical product [Anshin Palette]."
Premiums declined as limited-pay policies reached paid-up status—a structural headwind that has persisted for several years . Persistency remains solid at 93.1%, down slightly from 93.4% a year ago . Notably, lapses on the first sector savings block remained low despite the increase in yen interest rates . Investment income fell on lower floating-rate dollar portfolio yields and reduced variable income .
Japan Premium Persistency Trend (12-month rolling)
Note: Beginning January 2025, methodology excludes annuitizations, premium halving, and waiver premium from terminations; prior periods not restated
Aflac U.S.: Premium Growth, Margin Compression
Source:
The U.S. segment grew premiums 4.0% on improved sales and persistency of 79.2% . The total benefit ratio came in at 48.6%, 230 basis points higher than Q4 2024, driven by prior year endorsements and higher claims activity on the individual voluntary block, as well as higher benefits on group life and disability . Reserve remeasurement gains impacted the benefit ratio by approximately 140 basis points . Pretax adjusted profit margin compressed to 17.4% from 19.7% a year ago .
Sales grew 3.1%, primarily from group voluntary products . For the full year, U.S. sales reached $1.59 billion, up 3.0% .
What Did Management Guide?
Management provided explicit 2026 guidance ranges, largely reaffirming the outlook from the 2024 Financial Analyst Briefing with a few key adjustments :
Aflac Japan 2026 Outlook
Management noted stronger than expected pretax profit margin for 2026, driven by a lower benefit ratio on new business compared to the inforce block :
Source:
Aflac U.S. 2026 Outlook
Management affirmed that 2026 ranges remain intact as new businesses continue to scale :
Source:
Key forward themes:
- Japan: Promote Miraito, Tsumitasu, and Anshin Palette to younger customers
- U.S.: Continue scaling new business lines (group life/disability, network dental/vision, direct-to-consumer) which add 60bps to the expense ratio
- Capital return: Balanced approach between growth investments and shareholder returns
How Did Aflac Return Capital?
Aflac's capital return story remains a key investment thesis:
Q4 2025 Capital Deployment
*Source: *
Quarterly Capital Deployment Trend (FY 2025)
Source:
At quarter-end, Aflac had 114.3 million shares remaining under its repurchase authorization . Shares outstanding fell to 518.7 million, down 5.7% from 550.0 million a year ago .
Capital Position
Aflac's capital ratios remain robust, providing flexibility for continued shareholder returns :
Source:
ESR & RBC Sensitivities (as of December 31, 2025)
Source:
Management enhanced liquidity flexibility in Q3 2025 by creating $2 billion in off-balance sheet pre-capitalized trusts (PCAPS), allowing them to reduce the minimum liquidity balance at the holding company by $750 million to $1 billion . The company holds ~63% of debt in yen as part of its enterprise hedging program to protect the economic value of Aflac Japan in dollar terms .
How Did the Stock React?
AFL shares rose 1.4% to $113.62 following the release, just 2% below the 52-week high of $115.84. The stock is now:
- +3.4% above the 50-day moving average ($109.85)
- +6.1% above the 200-day moving average ($107.12)
- +17.2% above the 52-week low of $96.95
The muted reaction despite the large EPS beat likely reflects:
- Market expectation that investment gains are volatile and non-recurring
- Underlying adjusted earnings were essentially flat
- Revenue decline raised questions about core growth
What Changed From Last Quarter?
*Source: *
Q3 2025 benefited from unusually favorable reserve remeasurements in Japan that compressed benefits ratios. Q4 returned to more normalized levels . The Japan benefit ratio jumped from 39.3% in Q3 to 65.0% in Q4 .
Q&A Highlights: What Analysts Asked
The earnings call Q&A revealed several key investor concerns and management insights:
Japan Savings Products & Yen Rate Sensitivity
Wes Carmichael (Wells Fargo) asked about surrender risk on interest-sensitive products given rising yen rates. CFO Max Brodin acknowledged the concern but noted no impact yet:
"If everybody is 100% efficient in their behavior, you would expect both demand and potentially lapsation of in-force policies to increase somewhat. We have not experienced that yet, but obviously it's something that we closely monitor and prepare the company for."
Japan Benefit Ratio: Three Drivers Explained
John Barnidge (Piper Sandler) pressed on the lower Japan benefit ratio guidance. Max outlined three factors :
- Net Premium Ratio Update (permanent): Q3 2025 actuarial assumption update lowered the NPR by ~130bps, directly impacting future benefit ratios
- Lapse & Reissue Activity: New product launches (Miraito, Anshin Palette) cause elevated lapse/reissue; old policies release reserves, lowering the benefit ratio
- WAYS Block Runoff: The 2010-2016 life insurance savings block carries a high GAAP benefit ratio but is shrinking, improving the mix
"About one-third of [the benefit ratio decline] is driven by the lower net premium ratio. The other two-thirds will occur both on a US GAAP basis and on an FSA earnings basis."
U.S. Sales: Group Business Outperformance
Tom Gallagher (Evercore ISI) asked about the breakdown between group and voluntary sales. President Virgil Miller provided detailed color :
"When you have that anchor of a core business, you don't see the tremendous explosive growth that you are seeing... on the group side. If you look at isolated, just on group policies... the overall growth would have been 14%."
CEO Dan Amos added context on traditional business challenges:
"As we reflect back over the COVID period... it wasn't the product that changed things, it was the number of producers out in the field force selling for us. They were pulled away to a degree... and replacing those people has taken some time."
When Will Japan Premiums Inflect Positive?
Tom Gallagher followed up on why strong Japan sales aren't translating to premium growth. Max explained the math :
"We're somewhat the victim of very strong persistency. So if you think about Japan, it's a very, very, very large in-force block, and the new sales that we're adding each year is relatively small relative to the total in-force block because of the high persistency that we have... COVID had a couple of years where our sales dropped quite significantly, and the delta between sales and lapses was significant, and we are closing in on that gap now."
Management indicated a positive inflection is expected "within a reasonable future" but noted lapses will still exceed sales in 2026.
AI Strategy & Technology Investments
Alex Scott (Barclays) asked about AI exposure in both operations and the investment portfolio. Key takeaways :
Investment Portfolio: Global Chief Investment Officer Brad Dyslin noted 1.5% exposure to software companies—half in first-lien senior secured middle market loans ($15M average size), half in A-minus rated investment-grade credits.
Operations: Virgil Miller detailed AI adoption:
- Claims: >60% of traditional business claims are automated using machine learning; AI provides adjudicator advice but humans make final decisions
- Enrollment: Enhanced enrollment platform leveraging AI launched in Q1 2026
- Japan: Exploring AI for product innovation and distribution, working closely with the FSA
"Technology, we're not looking to replace the people. It's a high-touch business when it comes to delivering on that promise and paying claims. We want to make sure that AI is assisting us with that."
M&A Optionality
On capital deployment for M&A, Max acknowledged significant dry powder but set expectations :
"Do we have capital available, if we wanted to do something? That is absolutely true. But I would also acknowledge that we are operating in a relatively narrow niche, both in the United States and in Japan, and to sort of find operational and strategic targets within those niches is relatively difficult to find."
Full Year 2025 Summary
*Source: *
The divergence between net earnings (-33%) and adjusted earnings (-1.6%) highlights the volatility of investment gains. Excluding those gains and currency impacts, adjusted EPS grew 3.5% .
Key Risks and Concerns
-
Yen Weakness: The average yen/dollar rate was 154.20 in Q4 2025, 1.2% weaker than Q4 2024. Further yen depreciation pressures translated earnings .
-
Japan Premium Runoff: Net earned premiums in Japan have declined for 7+ consecutive years as limited-pay policies mature. This structural headwind continues .
-
U.S. Margin Pressure: The U.S. pretax margin fell to 17.4% from 19.7%, driven by higher benefits costs .
-
Investment Volatility: Q4 2025's $537M gain followed Q3 2024's $(1.3)B loss. These swings create earnings unpredictability .
-
Credit Quality: The company recorded $22 million in charge-offs on first lien senior secured middle market loans during the quarter, though commercial real estate had no charge-offs or foreclosures .
Forward Catalysts
The Bottom Line
Aflac's Q4 2025 results delivered a headline EPS beat driven by investment gains, while the underlying insurance business showed steady but unspectacular performance. Japan sales momentum (+15.7%) is encouraging, but premium runoff remains a headwind. The U.S. grew premiums but saw margin compression. With a 43-year dividend growth streak, 2%+ dividend yield, and aggressive buybacks, AFL remains a capital return story—but investors should look past volatile GAAP earnings to the more stable adjusted figures.
This analysis incorporates Aflac's Q4 2025 earnings call held February 5, 2026. View the full transcript and 8-K filing for complete details.